Gold Price Analysis: Rebounds from weekly lows, lacks follow-through
- Gold once again manages to find some suport near the $1562 region.
- Mixed technical set-up warrants some caution for aggressive traders.
Gold quickly reversed an early dip to weekly lows and is currently placed near the top end of its daily trading range, around the $1566 region.
The intraday downtick attracted some buying near the $1662 region, which coincides with 50% Fibonacci level of the $1548-$1577 recent positive move.
The mentioned support should now act as a key pivotal point for short-term traders and help determine the next leg of a directional move for the commodity.
Meanwhile, technical indicators on hourly charts have again started gaining negative traction and support prospects for a further near-term depreciating move.
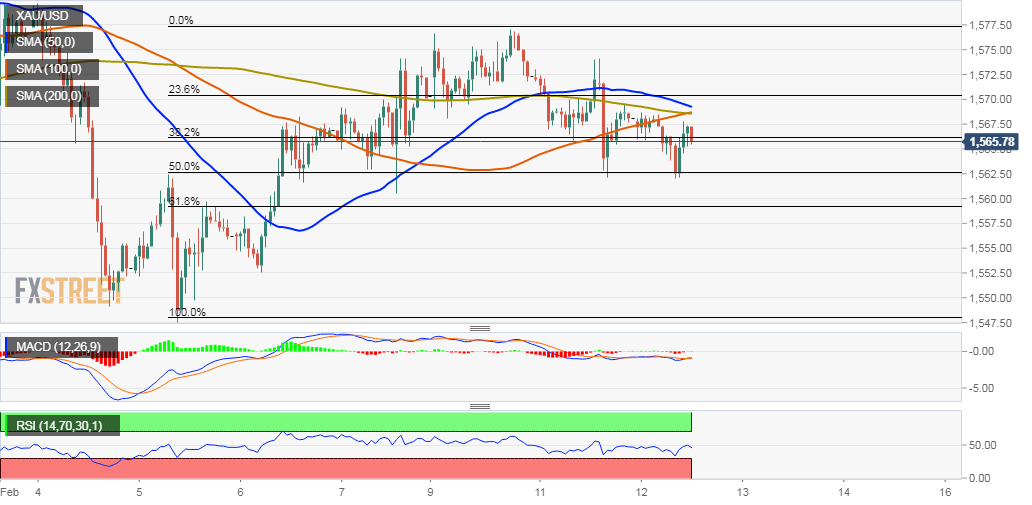
This coupled with the fact that the commodity is holding below important intraday moving averages – 50, 100 & 200-hour SMAs – adds credence to the negative outlook.
However, oscillators on the daily chart have still managed to hold in the bullish territory and warrant some caution before placing aggressive bearish bets.
Hence, it will be prudent to wait for some follow-through selling below the $1562-60 region, which if broken might expose $1550-48 support area (recent swing lows).
Gold 1-hourly chart