Back


17 Feb 2020
USD/INR New York Price Analysis: Greenback limited by 71.60 resistance vs. yen
- USD/INR stays trapped in a tight range as the new week starts.
- The level to beat for sellers is the 71.20 support.
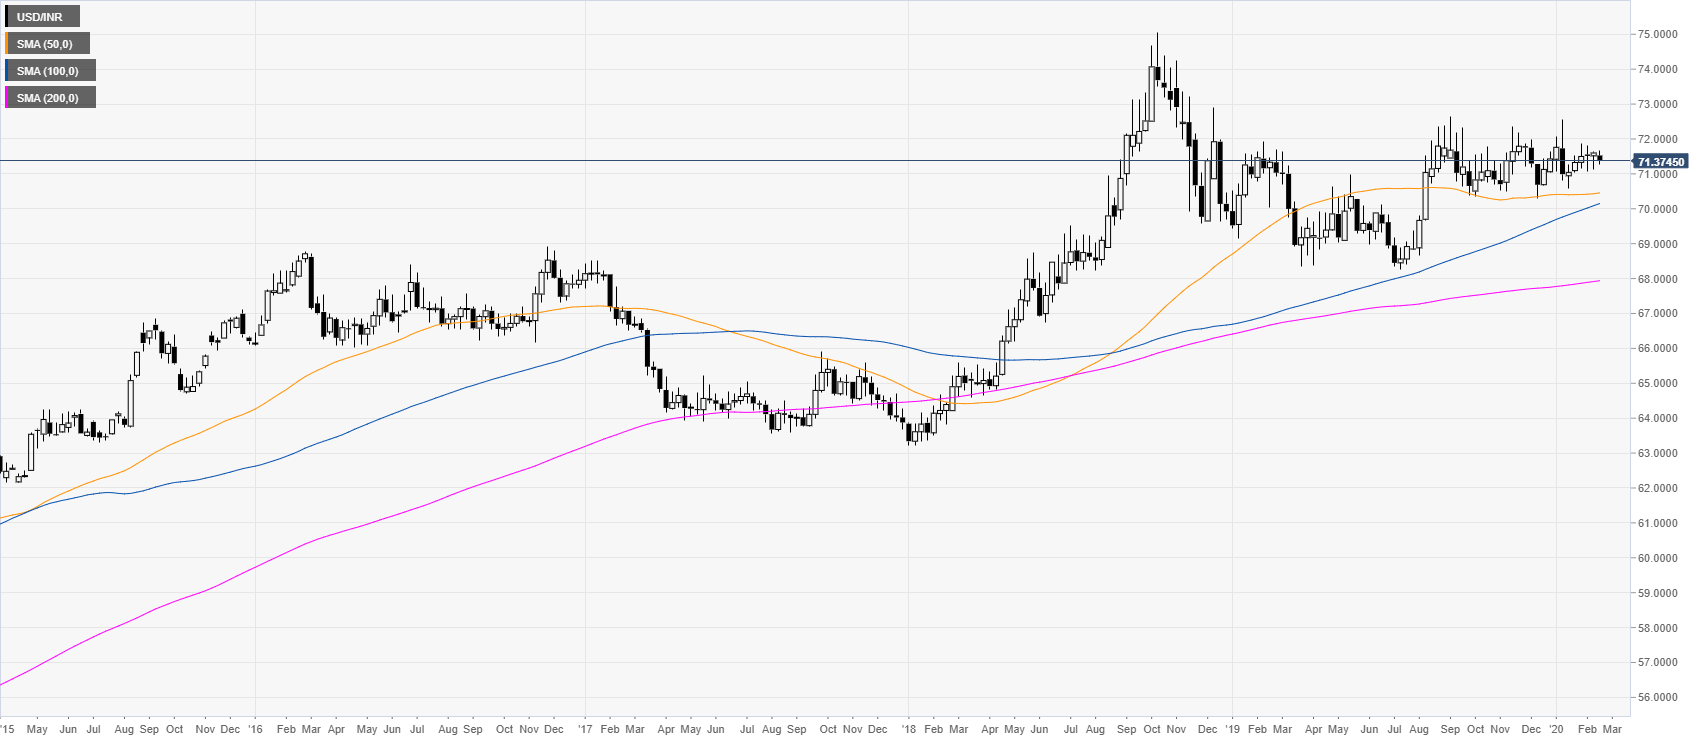
USD/INR weekly chart
After the 2018 bull-market, USD/INR has been consolidating in a rectangle formation. The quote is trading above its main weekly simple moving averages (SMAs), suggesting a bullish momentum in the long term.

USD/INR daily chart
The spot broke below a bear flag pattern and challenged the 71.20 support level to retest the 71.60 resistance. However, USD/INR has entered a tight sideways market while remaining vulnerable below the 71.60/72.00 resistance zone. However, a daily close above the 72.00 figure would likely invalidate the bearish scenario and generates further upside towards the 72.40 level.

