GBP/USD Price Analysis: Multiple upside barriers to check recent recovery
- GBP/USD consolidates losses while heading towards the short-term resistance line.
- 200-bar SMA, another falling trend line resistance also challenge the buyers.
- November month low remains on the bears’ radars.
GBP/USD rises 0.11% to 1.2942 by the press time of early Tuesday. The pair retraces the previous day’s losses while heading towards the near-term key resistances. Though, a higher number of the upside barriers will challenge the optimists.
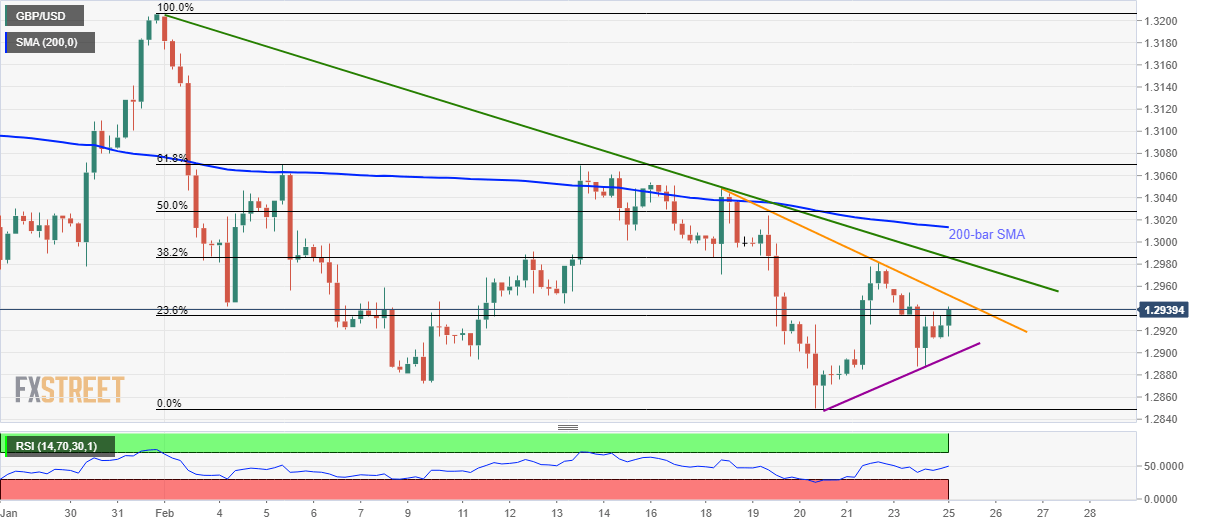
Among them, a one-week-old falling trend line at 1.2952 and another one declining from January 31, near 1.2985, hold the key to the pair’s run-up towards 200-bar SMA level of 1.3013.
Should there be a further increase in the GBP/USD pair’s prices beyond 1.3013, 50% and 61.8% Fibonacci retracements of its declines between January 31 and February 20, respectively around 1.3030 and 1.3070, will question the buyers.
On the downside, a three-day-long rising trend line near 1.2900 acts as the immediate support, a break of which could drag the quote towards the monthly low of 1.2849.
Assuming the pair’s sustained declines below 1.2849, lows marked during the November month near 1.2820 and 1.2770 can lure the sellers.
GBP/USD four-hour chart
Trend: Bearish